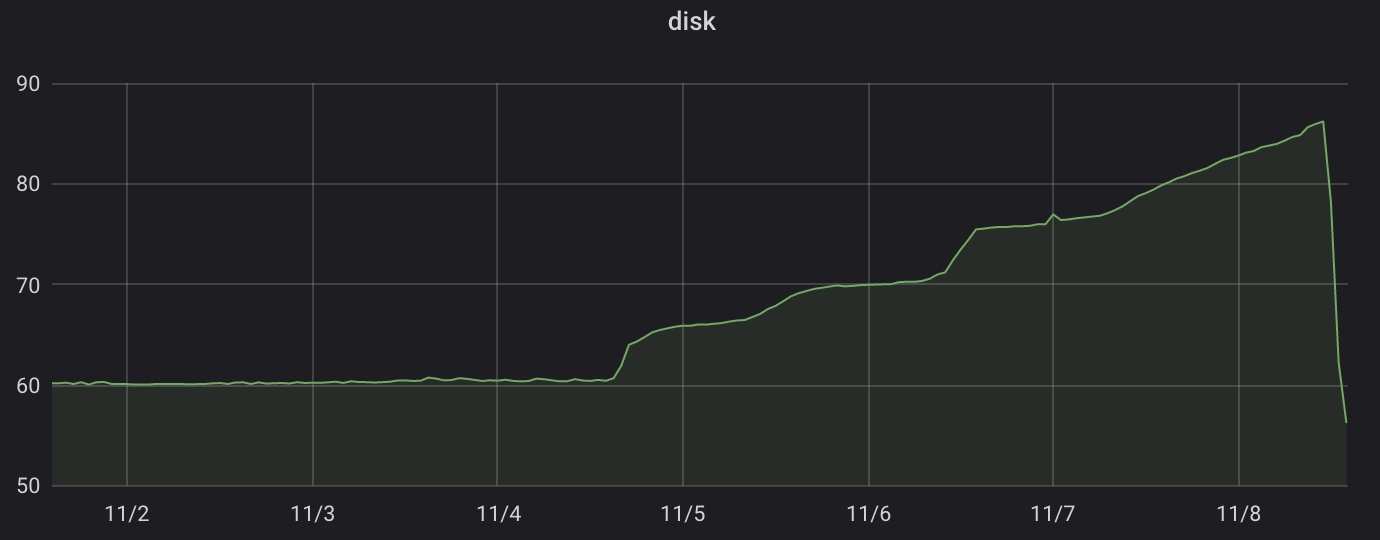
PostgreSQL archiver failure
We've got an alert that disk space on a server with a production database is running low.
We have a separate partition (and separate physical SSDs) that stores PostgreSQL
data (/var/lib/postgres/), so that nothing can interfere with PG, and this
partition was running low on free space. Database size was pretty stable at
3.5 TB, but WALs were accumulating and we already had 2+ terabytes of them. We
have archive_mode = on (docs
here)
that sends completed WAL segments to archive storage by running
archive_command (we're using wal-g 0.22.2).
Looks like it wasn't succeeding for some reason.
Our monitoring suggested that WAL accumulation started on Thursday, around 12:30
UTC. We could afford to lose these WALs, so we tried to change archive_command
to /bin/true and reload the config, but it did nothing and WALs kept
accumulating, instead of disappearing like we expected them to.
We turned off a write-heavy workload that generated most of those WALs to buy us more time and tried to understand what was happening. We looked through logs (nothing), poured through documentation — learned nothing useful from it.
We googled different things and looked through many articles, but they were
talking about other things that we knew, nothing useful for us. Then we stumbled
across this
one from Percona blog that has this wonderful image and it explains how the whole
thing works, separate archiver process together with ***.ready and ***.done
files.
So Postgres has a separate archiver process... right. I tried ps aux | grep archiver and voila, there is a line with
postgres: 13/main: archiver archiving 000000010001AFCD000000D6
Looks like it's stuck on this segment. For several days, as it seems. In PostgreSQL logs we've found this:
INFO: 2021/11/04 12:23:29.559454 FILE PATH: 000000010001AFCD000000D5.br
INFO: 2021/11/04 12:23:30.313433 FILE PATH: 000000010001AFCD000000D7.br
INFO: 2021/11/04 12:23:30.423031 FILE PATH: 000000010001AFCD000000D8.br
INFO: 2021/11/04 12:23:30.584363 FILE PATH: 000000010001AFCD000000D6.br  # <----
INFO: 2021/11/04 12:23:31.196299 FILE PATH: 000000010001AFCD000000DA.br
INFO: 2021/11/04 12:23:31.248269 FILE PATH: 000000010001AFCD000000D9.br
INFO: 2021/11/04 12:23:31.790405 FILE PATH: 000000010001AFCD000000DB.br
# ...files in order...
INFO: 2021/11/04 12:23:39.821431 FILE PATH: 000000010001AFCD000000EB.br
INFO: 2021/11/04 12:23:40.349363 FILE PATH: 000000010001AFCD000000ED.br
ERROR: 2021/11/04 12:23:40.780994 failed to upload 'pg_wal/000000010001AFCD000000EC.br' to '*****': RequestError: send request failed
caused by: Put https://*****/*/000000010001AFCD000000EC.br: write tcp *.*.*.*:33060->*.*.*.*:443: use of closed network connection
INFO: 2021/11/04 12:23:40.781011 FILE PATH: 000000010001AFCD000000EC.br
ERROR: 2021/11/04 12:23:40.781029 Error of background uploader: upload: could not Upload 'pg_wal/000000010001AFCD000000EC'
: failed to upload '000000010001AFCD000000EC.br' to bucket '*****': RequestError: send request failed
caused by: Put https://*****/*/000000010001AFCD000000EC.br: write tcp *.*.*.*:33060->*.*.*.*:443: use of closed network connection
INFO: 2021/11/04 12:23:40.865590 FILE PATH: 000000010001AFCD000000EE.br
# ...files in order...
INFO: 2021/11/04 12:23:45.359512 FILE PATH: 000000010001AFCD000000F7.br
# backup lines stop here
Time corresponds nicely with our approximate timeline of 12:30 UTC from
monitoring, where we start seeing disk usage starts trending upwards. There are
errors with 000000010001AFCD000000EC WAL segment, and indeed we didn't have
000000010001AFCD000000EC.br in our backup location (we use Brotli to compress
our WAL segments, hence .br extension). Maybe Postgres archiver would have
tried up to three
times
to re-upload it again if it wasn't stuck on 000000010001AFCD000000D6.
So we tried to make it unstuck. Archiver process didn't react to kill (that
explains why it didn't react to config change that propagates with SIGHUP), so
kill -9! It died and Postgres launched a new
archiver
that went about deleting all the old WALs due to our
archive_command=/bin/true. Finally.

We use PostgreSQL 13.2. Was it a bug in PostgreSQL
archiver
or something else? Not sure wal-g and its version is very relevant because
it's launched in a separate process.
I have no idea how to inspect an inner state of PostgreSQL archiver and no knowledge about its inner workings and wasn't ready to pour a couple of days into figuring that out on my production server.
